hierarchy(data, children)
Hierarchies | D3 by Observable (d3js.org)
分层数据
属性:
node.data - 传递给层次结构的相关数据
node.depth(节点深度)- 根节点的深度为 0,每一代子节点的深度增加 1
node.height(节点高度)- 与任何后代叶子的最大距离,叶子为 0
node.parent - 父节点,根节点为空
node.children–子节点数组(如果有),对于叶子则未定义
node.value - 节点及其子节点的可选加和值
方法:
node.ancestors():返回祖节点数组,从本节点开始,依次返回父节点直至根节点。
node.descendants():返回子节点数组,从本节点开始,然后按拓扑顺序依次返回每个子节点。
node.find(filter):返回从该节点开始的层次结构中,指定的过滤器返回真值的第一个节点。如果没有找到这样的节点,则返回未定义的值。
node.path(target):返回从该节点到指定目标节点的层次结构中的最短路径。路径从本节点开始,上升到本节点和目标节点的最小共同祖先,然后下降到目标节点。这对分层边缘捆绑非常有用。
node.links():返回此节点及其子节点的链接数组,其中每个链接都是一个定义了源和目标属性的对象。每个链接的源是父节点,目标是子节点。
node.values():在后序遍历中对该节点和每个子节点的指定值函数进行评估,并返回该节点。每个节点的 node.value 属性将被设置为指定函数返回的数值加上所有子节点的合并值。函数传递节点的数据,必须返回一个非负数。值访问器将对节点和每个子节点(包括内部节点)进行评估;如果只想让叶节点具有内部值,那么任何有子节点的值都将返回零。例如,作为 node.count:
node.count():计算该节点下的叶子数,并将其赋值给 node.value,并对节点的每个子节点进行类似计算。如果此节点是叶子,则其计数为 1。返回此节点。另请参阅 node.sum。
node.sort(compare):使用指定的比较函数,以预序遍历的方式对该节点的子节点(如果有)和该节点的每个子节点进行排序,并返回该节点。
模块:环形树状结构
可视化背景
圆环图(或称为环形图)是一种可视化方法,用于展示层次结构或组成关系。在圆环图中,数据或信息通过圆环的分区来呈现,每个分区代表一个层次或一个部分。通常,内部圆环代表整体,外部圆环则显示组成部分或层次。
然而,为了将圆环图和边聚合图结合,并且考虑到本项目中需要展示的依赖关系是叶子节点和叶子节点之间的,因此需要对圆环图进行一定的改造。更具体地:1)需要将叶子节点排列在圆环内部,从内向外,分别是子节点-父节点。2)考虑到叶节点的深度各不相同,需要齐次化层次结构,实现对齐设计。
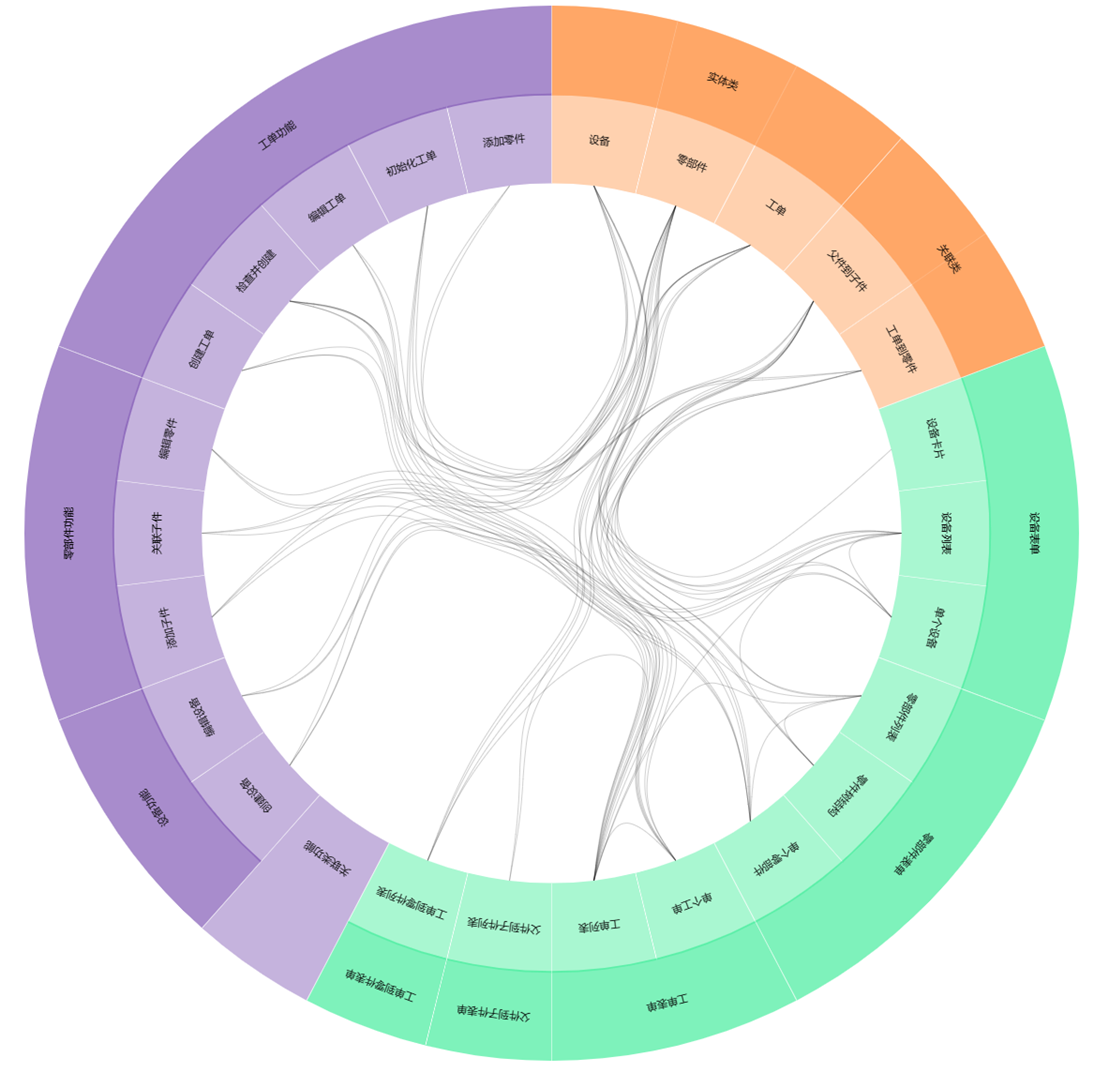
实现的功能
扇形嵌套-树状结构
整个圆环图采用扇形嵌套树状结构,将树状结构以扇形的方式呈现,其中树的各个层次通过扇形的半径表示,并且子节点相对于父节点呈现在更内层。这种结构有几个优点:
- 层次性展示: 扇形嵌套树状结构非常适合呈现层次性数据,因为它清晰地显示了树的各个层次。每个节点的深度可以通过在扇形中的位置和半径来表示,使得观察者能够直观地了解数据的层次结构。
- 节省空间: 相较于传统的直线式树状结构,扇形嵌套可以更有效地利用空间。节点内部相对较小,使得在较小的可视化区域内展示更多的信息,这对于较大的树状结构尤其有用。
- 凸显层次关系: 通过节点的位置和大小差异,扇形嵌套树状结构突出了不同层次之间的关系。父节点在扇形的外侧,子节点则朝向内部排列,强调了层次间的分离和连接。
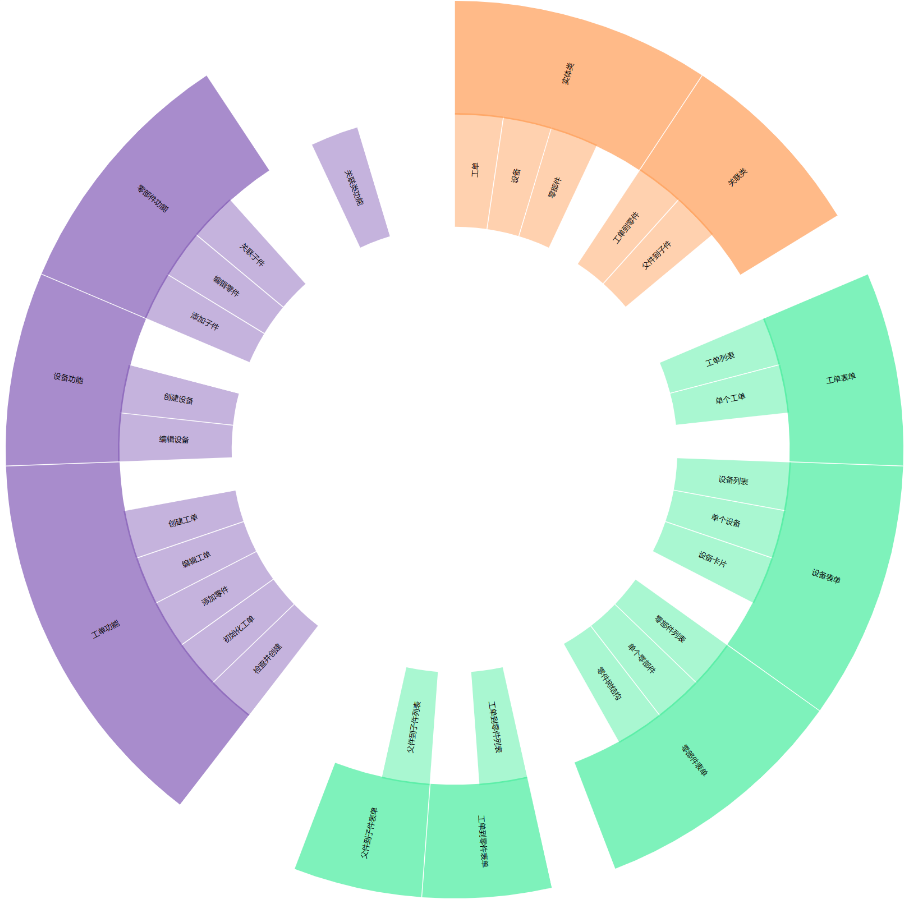
倒序布局
由于需要呈现叶子节点和叶子节点之间的相互依赖关系,则不同于传统的圆环图布局(图),根节点在最内侧,向外依次排列子节点的形式。
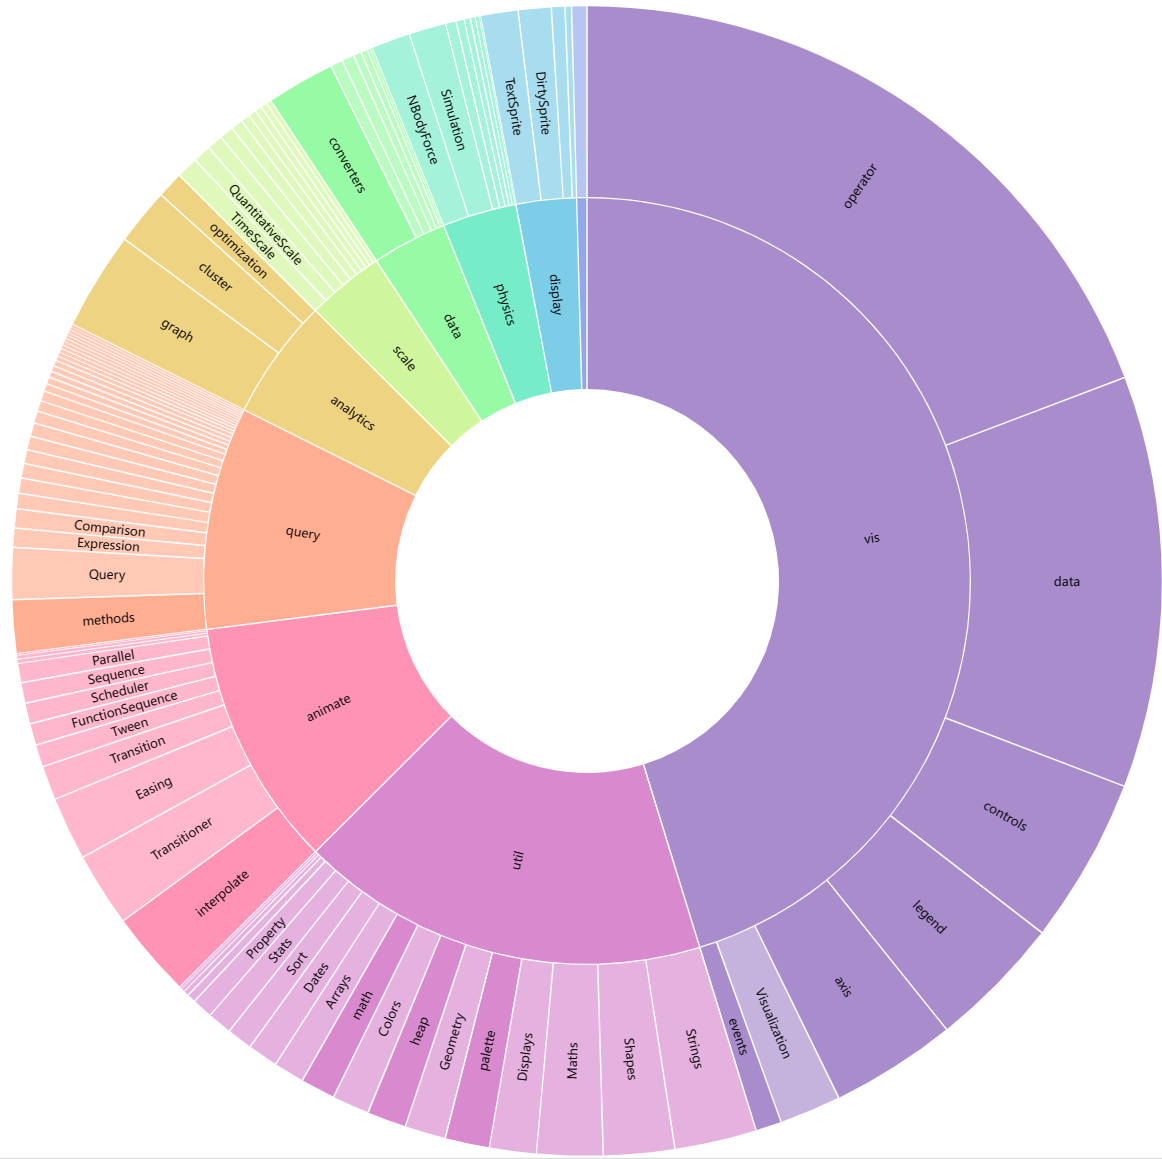
本项目需要让子节点放置在最内侧,并以边聚合图的形式在中心呈现叶子节点的依赖关系。因此采用倒序布局,圆环的自内向外分别是子节点-父节点。
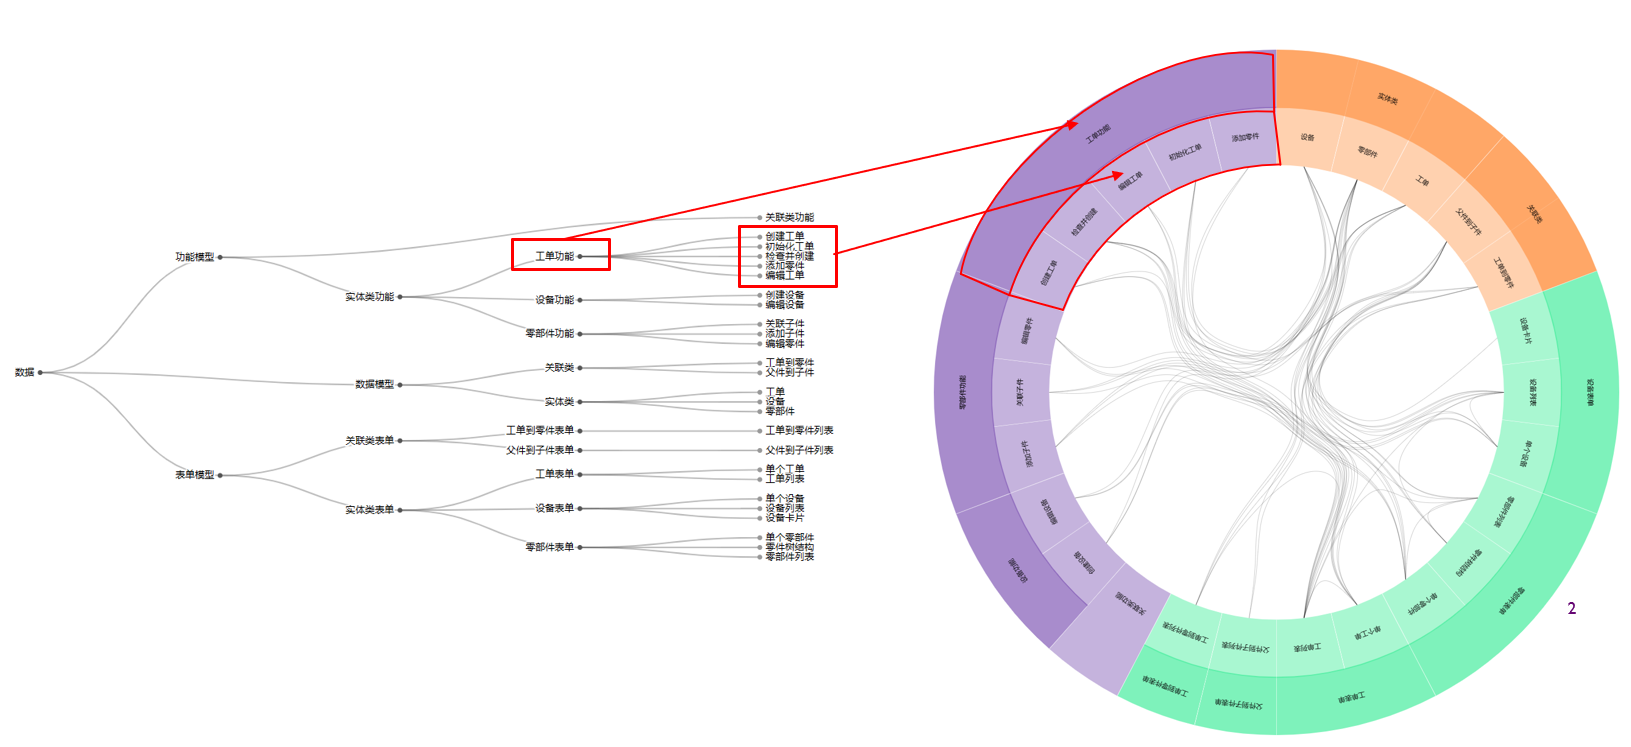
虚拟节点设计
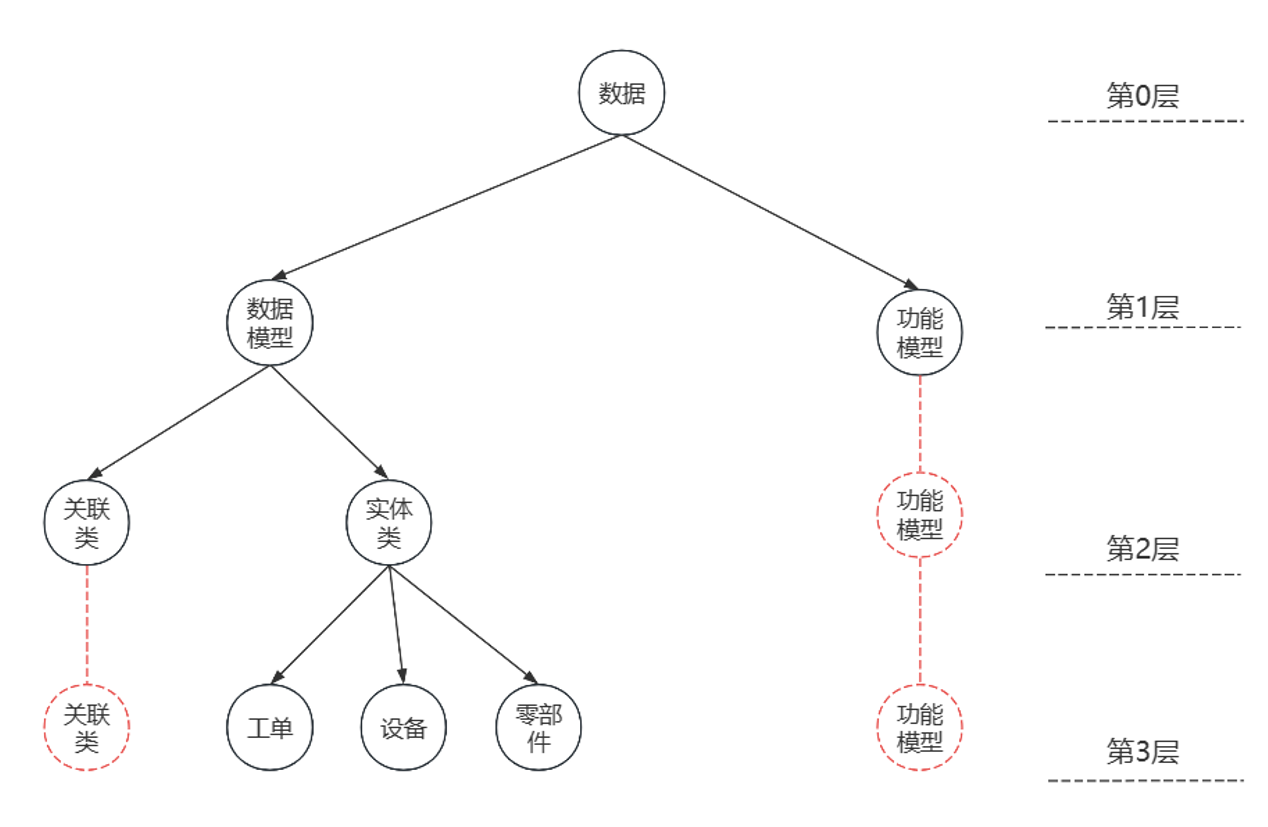
为了解决倒序布局下,叶子节点的深度不一致导致层次关系错乱无法对齐的问题(如图)。对于叶子节点关联类它的深度为2,而对于叶子节点功能模型它的深度为1,而其余叶子节点的深度都为3,那么如果让所有叶子节点都显示在内圈,则他们外层的父节点无法对齐。因为对于叶子节点功能模型它的父节点是树的根节点,与其他叶子节点的父节点都不在同一层次上。
会导致如下的显示异常/错乱的情况,特别是当对圆弧进行Zoom in/out变换时
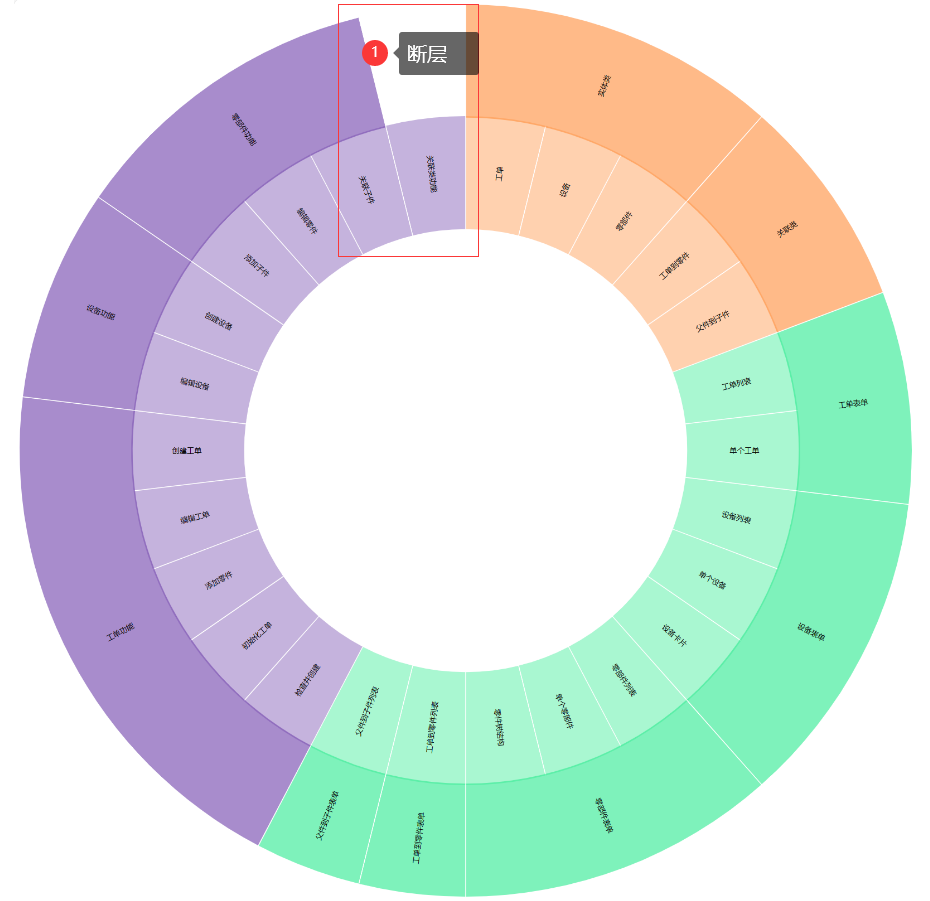
为解决上述问题,我们引入了“虚拟节点”的概念以及节点“厚度”的概念。
虚拟节点:对于所有$depth<maxDepth$的叶子节点我们为其添加$maxDepth-depth$个虚拟节点,如上图中红色节点所示。如此引入虚拟节点后,将所有节点的层次进行了对齐。
厚度:对于所有$depth<maxDepth$的叶子节点我们设置其厚度为$maxDepth-depth+1$,那么在渲染圆弧的时候,他们所对应的圆弧高度和其厚度成正比。例如对于上述叶子节点功能模型,它的$depth=1,而maxDepth=3,因此它的厚度为3$。其对应的圆弧应占据三层的宽度(即涵盖了它的虚拟节点所占圆弧的宽度)。
通过引入“厚度”的设计,实际上避免了引入“虚拟节点”的物理实体。在原来的数据结构中,所有的虚拟节点都用厚度来代替了,避免引入冗余的节点。同时简化了Zoom in/out的实现。
更具体的Zoom in/out仅修改节点的height和thickness属性。
- Zoom in:指着聚焦于图表的局部,使该局部更大并填满整个视图,以便更详细地查看该部分的内容。
- Zoom out:意味着减小局部区域的尺寸,使整个图表在视图中呈现更广阔的范围。
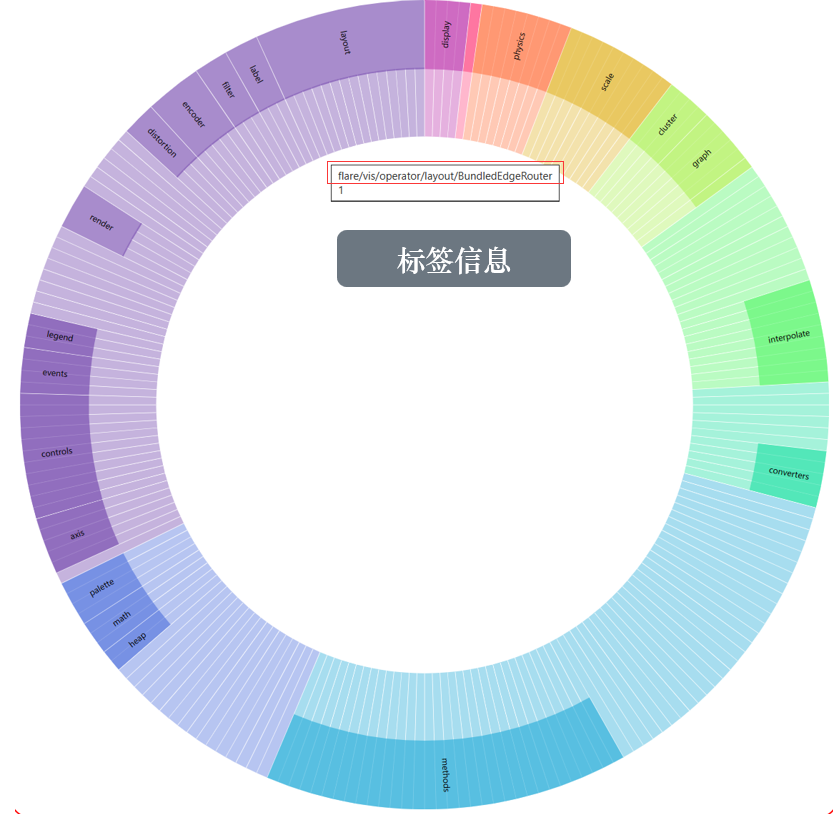
显示效果优化
为了更好呈现可视化效果,做了如下优化:
- 自适应横向/纵向标签:计算节点所在圆弧的宽度和高度,对标签进行自适应的横向或纵向显示。如宽度足够,则进行横向显示;如高度足够,则进行纵向显示;如都不够,则隐藏标签。
- 添加鼠标移入事件:当鼠标移入节点时,显示节点的层次信息和其子节点数量。
- 当节点数量过多则隐藏节点名称
- 鼠标移入高亮效果
实现方式
数据处理部分
1
2
3
4
5
6
7
8
9
10
11
12
13
14
15
16
17
18
19
20
21
22
23
24
25
26
27
28
29
30
|
data = d3.hierarchy(data)
.sum(d => d.children ? 0 : 1)
.sort((a, b) => 1);
const width = 1200;
const level = 6;
const radius = width / (2 * level);
const color = d3.scaleOrdinal(d3.quantize(d3.interpolateRainbow, data.children.length + 1));
const tree = d3.cluster()
.size([2 * Math.PI, radius * 2 * level / 3]);
let root = tree(bilink(data
.sort((a, b) => d3.ascending(a.height, b.height) || d3.ascending(a.data.className, b.data.className))));
root = d3.partition()
.size([2 * Math.PI, root.height + 1])
(root);
const maxDepth = root.height;
root.each(d => d.thickness = d.children ? 1 : maxDepth - d.depth + 1);
root.each(d => d.current = d);
root.each(d => d.index = 0);
|
创建圆弧
1
2
3
4
5
6
7
8
9
10
11
12
13
14
15
16
17
18
19
20
21
22
23
24
25
26
27
28
29
30
31
32
33
34
|
const arc = d3.arc()
.startAngle(d => d.x0)
.endAngle(d => d.x1)
.padAngle(d => Math.min((d.x1 - d.x0) / 2, 0.005))
.padRadius(radius * 1.5)
.innerRadius(d => {
var innerRadius = (d.height + 2 * level / 3) * radius - 1;
return innerRadius - 1;
})
.outerRadius(d => {
var outerRadius = (d.height + Math.min(2, d.thickness) + 2 * level / 3) * radius;
return outerRadius;
});
const svg = d3.select("#d3ChartRight").append("svg")
.attr("width", width)
.attr("height", width)
.attr("viewBox", [-width / 2, -width / 2, width, width])
.attr("style", "max-width: 100%; height: auto; font: 10px sans-serif; margin: 0 auto; display: block;");
const path = svg.append("g")
.selectAll("path")
.data(root.descendants().slice(0))
.join("path")
.attr("fill", d => {
while (d.depth > 1) d = d.parent;
return color(d.data.displayName||d.data.name);
})
.attr("fill-opacity", d => arcVisible(d.current) ? (d.children ? 0.6 : 0.4) : 0)
.attr("pointer-events", d => arcVisible(d.current) ? "auto" : "none")
.attr("d", d => arc(d.current));
|
仅显示最内两层圆弧
1
2
3
| function arcVisible(d) {
return d.height <= 1 && d.height >= 0 && d.x1 > d.x0;
}
|
创建标签
1
2
3
4
5
6
7
8
9
10
11
12
13
14
15
16
17
18
19
20
21
22
23
24
25
26
27
28
29
|
const format = d3.format(",d");
path.append("title")
.text(d => `${d.ancestors().map(d => d.data.displayName||d.data.name).reverse().join("/")}\n${format(d.descendants().length)}`);
const label = svg.append("g")
.attr("pointer-events", "none")
.attr("text-anchor", "middle")
.style("user-select", "none")
.selectAll("text")
.data(root.descendants().slice(0))
.join("text")
.attr("dy", "0.35em")
.attr("fill-opacity", d => +labelVisible(d.current))
.attr("transform", d => labelTransform(d.current))
.text(d => d.data.displayName||d.data.name)
.style("font-size", "12px");
function labelVisible(d) {
return d.height <= 1 && d.height >= 0 && (d.y1 - d.y0) * (d.x1 - d.x0) > 0.03;
}
function labelTransform(d) {
const x = (d.x0 + d.x1) / 2 * 180 / Math.PI;
const y = ((d.height + 0.5 + 2 * level / 3) * radius);
return `rotate(${x - 90}) translate(${y},0) rotate(${90})`;
}
|
实现Zoom in/out
1
2
3
4
5
6
7
8
9
10
11
12
13
14
15
16
17
18
19
20
21
22
23
24
25
26
27
28
29
30
31
32
33
34
35
36
37
38
39
40
41
42
43
44
45
46
47
48
49
50
51
52
53
54
55
56
57
58
59
60
61
62
63
64
65
66
67
68
69
70
71
72
73
74
75
76
77
78
79
80
81
82
83
84
85
86
87
88
89
90
91
92
93
94
95
96
97
98
|
function clicked(event, p) {
if(transforming) return;
transforming = true;
root.each(d => {
let height = d.current.height;
let thickness = d.current.thickness;
if (p.parent == null) {
if (d.index <= 0)
return
height = d.originalHeight[d.index - 1]
thickness = d.originalThickness[d.index - 1]
d.index -= 1
} else {
if (!("originalHeight" in d)) d.originalHeight = [];
if (!("originalThickness" in d)) d.originalThickness = [];
if (d.index >= d.originalHeight.length) {
d.originalHeight.push(d.current.height);
d.originalThickness.push(d.current.thickness);
}
d.index += 1
let diff = p.current.height;
let count = 0;
if (d.children) {
d.descendants().forEach((c) => {
if (c.current.thickness > 1) {
count += 1
}
})
if (count != d.leaves().length) {
while (diff > 0 && thickness > 1) {
thickness -= 1
diff -= 1
}
while (diff > 0) {
height -= 1
diff -= 1
}
}
} else {
while (diff > 0 && thickness > 1) {
thickness -= 1
diff -= 1
}
while (diff > 0) {
height -= 1
diff -= 1
}
}
}
return d.target = {
x1: d.x1,
y0: d.y0,
y1: d.y1,
height: height,
thickness: thickness,
};
})
const t = svg.transition().duration(750);
.tween("data", d => {
const i = d3.interpolate(d.current, d.target);
return t => d.current = i(t);
})
.filter(function (d) {
return +this.getAttribute("fill-opacity") || arcVisible(d.target);
})
.attr("fill-opacity", d => arcVisible(d.target) ? (d.children ? 0.6 : 0.4) : 0)
.attr("pointer-events", d => arcVisible(d.target) ? "auto" : "none")
.attrTween("d", d => () => arc(d.current));
label.filter(function (d) {
return +this.getAttribute("fill-opacity") || labelVisible(d.target);
}).transition(t)
.attr("fill-opacity", d => +labelVisible(d.target))
.attrTween("transform", d => () => labelTransform(d.current))
.on("end", ()=> transforming = false);
let leaves = []
root.each(function (node) {
if (node.target.height === 0) {
leaves.push(node);
}
});
updateLink(leaves);
}
|